The steps to create a Page or RDL report are split into following activities:
- Select the report layout
- Add a dataset
- Add controls to the report
- View the report
- Save the report
Design Time
Run Time
Select the report type
- In the ActiveReports Server Report Portal, click the New Report button
 .
. - From the Create report pop-up window, select Page Report or RDL Report and click OK.
Add a dataset
Prerequisite
These steps assume that your administrator has already added a server shared data set based on the sample Factbook.xml data source. Only an ActiveReports Server administrator can add, remove, or modify server shared data sources and data sets. Here are the steps the administrator can follow to add this data set.
- Set the connection properties for the data source and the query for the data set as described in Reports with XML Data.
- Add a data source to the server as described in Shared Data Sources.
- Add a data set to the server as described in Server Shared Data Sets.
- In the Report Explorer, right-click the Server Data Sets node and select Add Data Set.
Note: The Add Data Set option is disabled if there are no data sets available in ActiveReports Server.
- In the Add Server Data Set dialog, select the data set and click OK.
Your data set and fields appear as nodes under the data source in the Report Explorer.
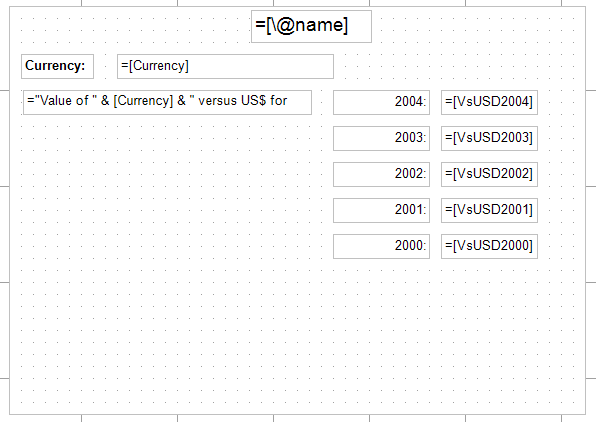
Add controls to the report
- From the toolbox, drag a List data region onto the design surface of the report and go to the Properties window to set the DataSetName property to ExchangeRates.
- From the Report Explorer, drag the @name field onto the list, center it at the top, and go to the Properties window to set the FontSize property to 14pt.
- From the Report Explorer, drag the following fields onto the list with properties set as described in the table below.
Field Name Property Name Currency Location: 1.125in, 0.5in
Size: 2.25in, 0.25inVsUSD2004 Location: 4.5in, 0.875in
Size: 1in, 0.25inVsUSD2003 Location: 4.5in, 1.25in
Size: 1in, 0.25inVsUSD2002 Location: 4.5in, 1.625in
Size: 1in, 0.25inVsUSD2001 Location: 4.5in, 2in
Size: 1in, 0.25inVsUSD2000 Location: 4.5in, 2.375in
Size: 1in, 0.25in - From the toolbox, drag a TextBox onto the list and set the properties as described in the table below to combine static text with the field value.
Property Name Property Value Location 0.145in, 0.875in Size 3in, 0.25in Value ="Value of " & Fields!Currency.Value & " versus US$ for year:" - From the toolbox, drag TextBox controls onto the list and set the properties as described in the tables below to create static labels.
TextBox1
Property Name Property Value Location 0.125in, 0.5in Size 0.75in, 0.25in FontWeight Bold Value Currency: TextBox2
Property Name Property Value Location 3.375in, 0.875in Size 1in, 0.25in TextAlign Right Value 2004: TextBox3
Property Name Property Value Location 3.375in, 1.25in Size 1in, 0.25in TextAlign Right Value 2003: TextBox4
Property Name Property Value Location 3.375in, 1.625in Size 1in, 0.25in TextAlign Right Value 2002: TextBox5
Property Name Property Value Location 3.375in, 2in Size 1in, 0.25in TextAlign Right Value 2001: TextBox6
Property Name Property Value Location 3.375in, 2.375in Size 1in, 0.25in TextAlign Right Value 2000:
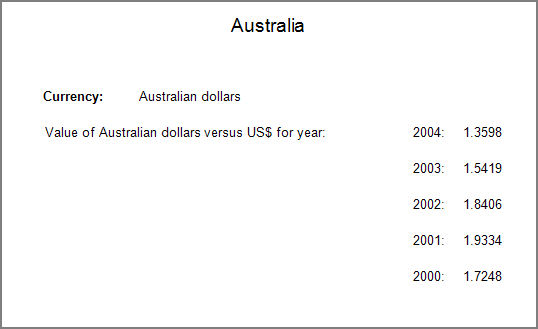
View the report
Click the Preview tab to view the report at run time.
Save the report
- In the File menu, click Save.
- In the Save As dialog that opens, enter the Report name and click Save.
You can also select the category where you want your report to appear, add a description, and add a comment to appear in the revision history.